Detecting transformation products in environmental monitoring is crucial, as these compounds often form when pollutants undergo chemical, biological, or physical transformations in the environment. Transformation products can be as (or even more) toxic, exhibit greater persistence, bioaccumulation, or bioactivity than the original substance, leading to long-term risks for ecosystems and human health. Persistent compounds can accumulate in water, soil, and air, where they may affect aquatic life, food chains, and human populations. Despite their significance, many transformation products remain unidentified, creating gaps in understanding their environmental presence and potential health impacts. By identifying transformation products, researchers and policymakers can develop more effective regulations and remediation strategies to mitigate their harmful effects. A thorough understanding of transformation products is essential for ensuring environmental safety and protecting both ecological systems and public health.
In this tutorial we describe how to use SIRIUS for non-targeted screening for transformation products. The software can be effectively employed to explore custom databases comprising potential structures, such as transformation products. You can find an example in our application note on the detection of pharmaceuticals and their transformation products in Luxembourgish rivers. In this tutorial, we will focus on the graphical user interface. For more information on CLI and API, refer to the SIRIUS documentation.
Simulating biotransformation
The annotation of transformation products requires a structure database of transformation products to search against. We generate a database of transformation products using BioTransformer1,2. BioTransformer is a computational tool designed to predict the metabolism of small molecules. It uses both a knowledge-based approach and a machine learning based approach to simulate how compounds are metabolized in various environments. For example it predicts how pollutants degrade in soil or water, helping to identify potentially harmful byproducts. Or it simulates how pharmaceuticals are metabolized in the human body, aiding in drug safety assessments.
Users provide the molecular structure of a compound (e.g., in SMILES format). BioTransformer predicts possible metabolic reactions and generates a list of transformation products. The user can select between 8 different options for metabolism prediction. For our study on pharmaceuticals in Luxembourgish rivers, we chose AllHuman, which predicts small molecule metabolism in the human superorganism. It covers biotransformations occurring both in human tissues as well as the gut microbiota. We predicted 3 steps. The resulting structures might not be unique, as BioTransformer can produce the same transformation product for multiple compounds. The final transformation product database should only contain unique structures.
Update: As of SIRIUS 6.2, BioTransformer is now seamlessly integrated directly into the software. This integration streamlines the process of generating bio-transformations, as they can now be automatically created during the custom database import process.
Importing Custom Database to SIRIUS
Structure database search in SIRIUS is not restricted to a specific database. Custom structure databases can be imported via the Databases dialog. To create a new custom database, click the Create custom database button. Structure databases can be imported as a single file (CSV or TSV), where structures are provided in SMILES format. You can also provide IDs and names for the entries. Structure databases can also be imported from directories or .zip files containing SDF files.

If a structure is already present in SIRIUS’ internal structure database, the fingerprint will be downloaded automatically. Otherwise, the fingerprint is computed locally on your computer, which may take some time, especially for a large number of structures.
You can import two separate databases for precursor structures and transformation products, making it easier to distinguish the source when analyzing results, or combine them into a single database.
Importing the LC-HRMS Data
LC-HRMS runs (as .mzml or .mzxml files) can be directly drag-and-dropped into SIRIUS. When importing multiple runs at once, SIRIUS will ask you if it should align them. The displayed feature list is already filtered by quality, i.e., features containing only MS1 spectra, features with bad quality and multimeric features are hidden. The LC-MS view displays the chromatographic feature alignment as well as a quality assessment of the spectra.
Compute Dialog: Annotation Workflow
The structure annotation workflow in SIRIUS is a non-targeted workflow. After molecular formula annotation, SIRIUS identifies the structure of a feature by predicting its molecular fingerprint and searching for matches in a molecular structure database.
Molecular formula annotation
Selecting an appropriate molecular formula annotation strategy is essential for conducting a successful SIRIUS analysis, as it directly influences the accuracy and efficiency of subsequent steps. Database search is recommended for identifying known compounds while ensuring extremely fast computation times. Choose the custom databases that you have imported (precursor structures, transformation products) and in addition a broader database that encompasses other molecules not covered by the precursors and transformation products. For biological contexts, use the biomolecule structure database (click the bio button), which aggregates several structure databases containing small molecules of biological interest.
You may want to set a total time limit (in seconds) for computing the fragmentation trees for all molecular formula candidates of a feature (this option is available in the Advanced settings).
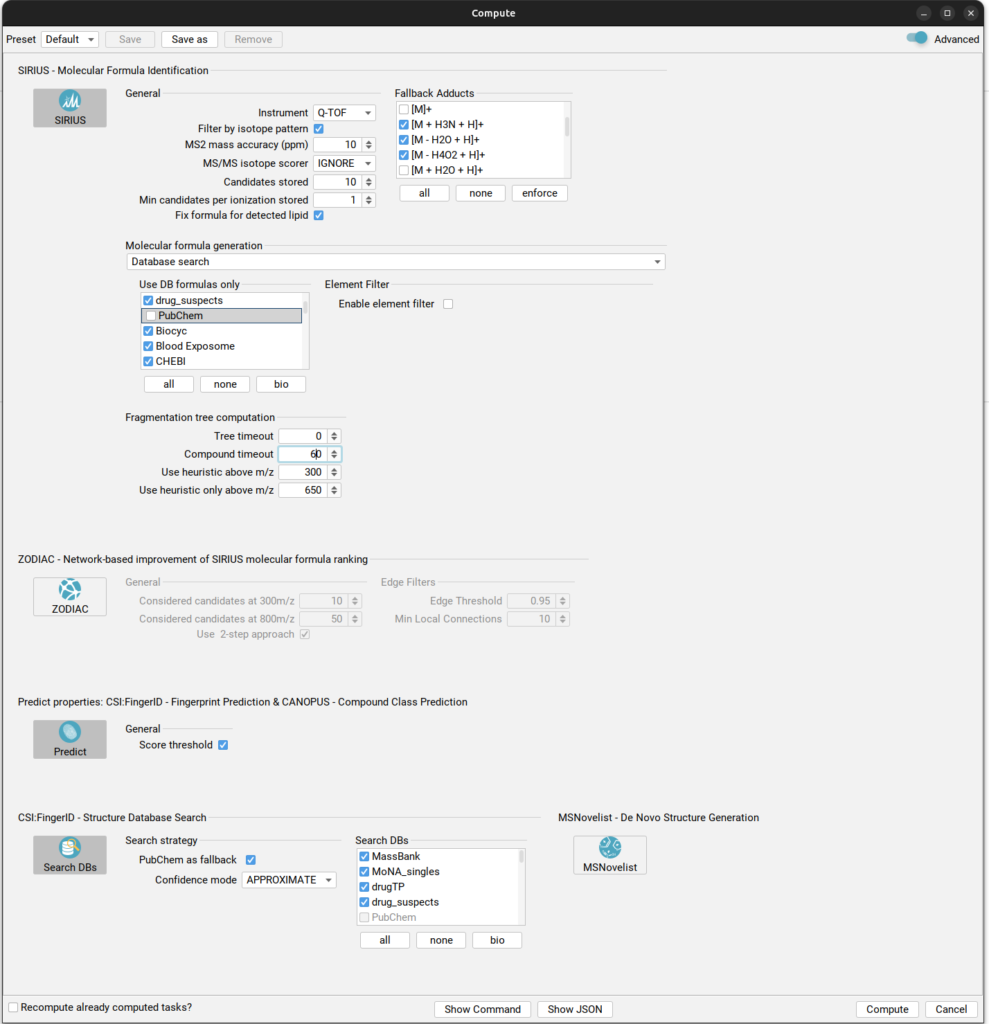
Recommended compute settings for identification of transformation products.
Structure annotation
SIRIUS identifies the structure of a molecule by predicting its molecular fingerprint and searching for matches in a molecular structure database. Fingerprints are only predicted for the best-scoring molecular formula per feature. This should only be disabled if there is a specific need to examine fingerprints associated with lower-scoring molecular formulas.
Alongside fingerprint prediction, SIRIUS will predict compound classes from the molecular fingerprint. This classification is done without relying on any structure database.
SIRIUS matches the predicted molecular fingerprints against the selected molecular structure databases. For a non-targeted analysis, it is essential to use a database containing the target compounds, as well as a complementary database covering the remaining compounds in the sample, which should be contextually appropriate. We select the imported custom databases (precursor structures and transformation products), as well as the biomolecule structure database. If database search was conducted for molecular formula identification, the same databases are pre-selected for structure identification, ensuring consistency in the analysis process.
PubChem can be used as a fallback database. If the top hit in PubChem has a confidence score at least twice as high as the top hit from the selected databases, the search is expanded to include PubChem results. This approach increases the likelihood of identifying molecular structures when the initial database search does not yield highly confident matches.
Investigating results
For each feature, different result views can be displayed in SIRIUS. SIRIUS provides multiple validation levels for a more in-depth investigation of results:
- the confidence score
- the
Structures view, visualizing how well candidate structures are supported by the predicted fingerprint - the
Substructure Annotations view, connecting possible substructures to the peaks of the MS/MS spectrum
Confidence score
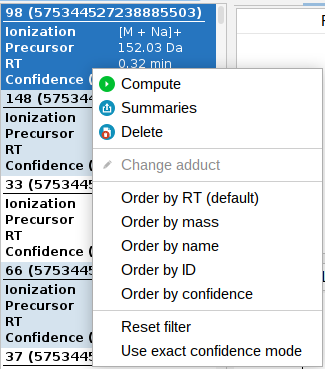
Confidence scores are automatically calculated every time a structure database search is performed, without the need for any user-defined parameters. This score should not be interpreted as a direct probability of correctness. It’s crucial to understand that these scores are not probabilities and, therefore, do not have a direct statistical interpretation. During evaluation, we found that a score of 0.64 approximately corresponded to a 10% FDR.
Confidence scores are generated in both, an exact and an approximate mode. The Exact Mode provides a confidence level for the precise match of the chemical structure. The confidence score may be low when the top and second-best candidate structures are very similar. The Approximate Mode determines whether the identified structure is correct or highly similar to the true structure.
Confidence scores are displayed in the feature list located on the left side of the interface. This allows users to quickly assess the confidence level (you can switch between exact and approximate) of the search results and make informed decisions about further analysis.
Structures view
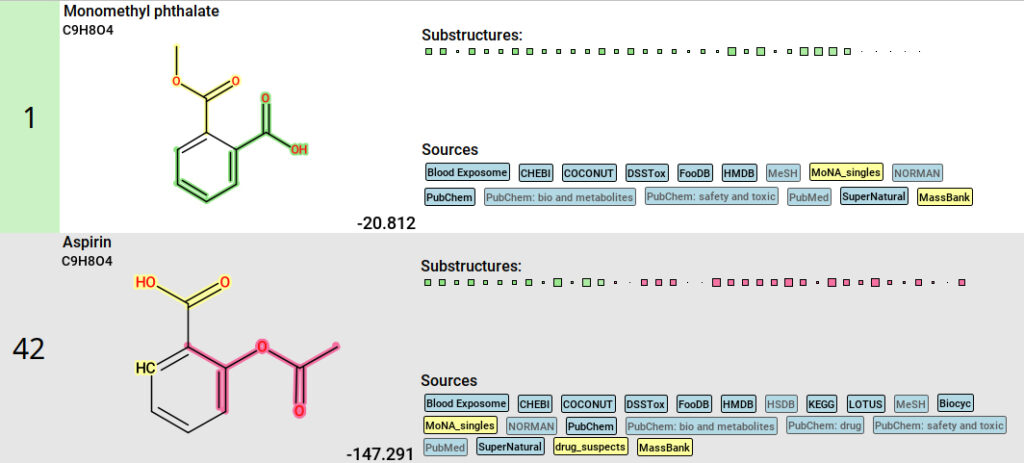
For each feature, you can investigate how well candidate structures are supported by the predicted fingerprint in the Structures view. For a selected molecular formula, you will find the list of candidate structures with the top hit highlighted in green. Based on the labels indicating in which databases the structure was found, you can determine whether the molecule is a precursor, a transformation product, or neither. Custom databases are labeled yellow.
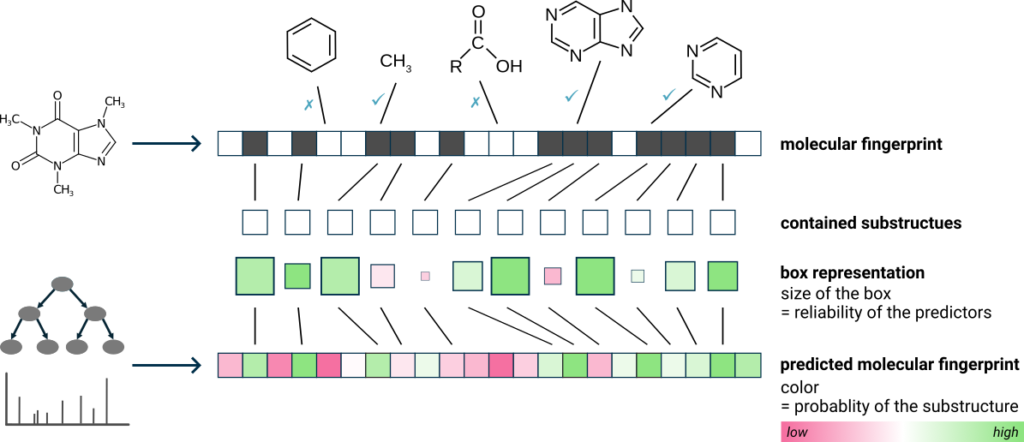
For each candidate structure, the fingerprint evidence is depicted as green and pink squares. Each square represents a molecular property, i.e. a substructure. Hovering over a square displays the description of the substructure and clicking highlights the corresponding atoms in the molecule. Green squares represent substructures in the candidate structure that were also predicted to be present. Pink squares are substructures that were predicted to be absent but are, nevertheless, found in the candidate structure. The intensity of the color indicates the predicted probability, and the size of the square reflects the reliability of the predictor. Overall, a correct prediction is typically characterized by many large, intense green squares and as few large, intense pink squares as possible.
You can also color highlight matching substructures for all candidates (right-clicking on a candidate structure ⇒ Highlight matching substructures). The color highlighting reflects substructures that are supported by fingerprint evidence (green), substructures that contradict fingerprint evidence (pink), and substructures with mixed support (yellow).
Substructure Annotations view
Finally, in the Substructure Annotations view you can investigate the direct connection between the input MS/MS spectrum and the candidate structures. Peaks in the spectrum are color-coded, with green peaks being associated to a substructure of the candidate structure, blue peaks explaining the molecular formula (but not the structure) of the candidate as part of the fragmentation tree, and black peaks which are considered noise or are not explainable by the precursor ion’s molecular formula. By clicking on a purple peak, the corresponding substructure is highlighted in the structure candidate.
Download results
Results can be exported as summary files in TSV, CSV or XLSX format. We recommend exporting the top hits only. Summaries are created separately for molecular formula annotation, structure annotation, and compound class prediction. These files provide convenient access to the results for downstream analysis, data sharing and data visualization. In the summary files, features are sorted by retention time. For data imported from LCMS runs, the detected aligned features are assigned consecutive numbers that serve as mappingFeatureID.
We are happy to receive feedback on the tutorial. Please let us know if anything remains unclear. You can find an exemplary use case in our application note on the detection of pharmaceuticals and their transformation products in Luxembourgish rivers.
References
- Yannick Djoumbou-Feunang et al. “BioTransformer: a comprehensive computational tool for small molecule metabolism prediction and metabolite identification”. In: J. Cheminf. 11.1 (Jan. 2019). ISSN: 1758-2946. DOI: 10.1186/s13321-018-0324-5.
- David S Wishart et al. “BioTransformer 3.0—a web server for accurately predicting metabolic transformation products”. In: Nucleic Acids Res. 50.W1 (May 2022), W115–W123. ISSN: 1362-4962. DOI: 10.1093/nar/gkac313.