
In untargeted metabolomics, researchers routinely juggle disjointed command-line utilities, complex graphical interfaces, and fragile file-handling scripts to move mass spectrometry data from alignment to annotation and statistical analysis. This lack of integration makes reproducibility difficult, if not impossible. With the release of SIRIUS 6 we introduce a powerful REST API that decouples computational storage from analytical access. Through PySirius, its OpenAPI-compliant Python client library, users can finally build fully automated, auditable, and self-contained pipelines entirely in Python.
In the recently published STAR Protocol, we together with the Böcker lab walk you through a complete, programmatic workflow using PySirius from data import with automated blank subtraction, feature quality filtering, chemical annotation, and differential abundance analysis.
The Scientific Proof of Concept
To validate the approach, the authors ran a complete analysis on a public metabolomics dataset of rosemary (Rosmarinus officinalis) tissue to replicate the well-established finding that rosmarinic acid is significantly enriched in old rosemary leaves compared to young leaves. Using the 4-step workflow below, the entire analysis runs seamlessly within a single, reproducible Python notebook, extracting biological truth directly from raw mass spec files.
Step 1: Import, align, filter
The pipeline begins by programmatically downloading raw data files and parsing experimental groupings. The groups of interest to replicate the rosmarinic acid finding are GROUP_YOUNG, GROUP_OLD, and GROUP_BLANKS. By assigning sample types as either “Sample” or “Blank”, the workflow filters out system contaminants during the import process, ensuring subsequent computations only process true biological signals. PySirius performs automated alignment and feature detection without requiring any measured standards for calibration.
Before starting computations, inspect the quality of the dataset and exclude low-quality entries. Be aware that this filtering step shapes every downstream result as the feature IDs of the surviving features are passed directly to the SIRIUS computation job, while features excluded here will not appear in any result, table, or plot.
Step 2: High-Confidence Feature Annotation
Feature annotation is the most time- and resource-intensive step. The pipeline comprises several annotation levels:
- Molecular formular annotation: Resolves exact elemental formulas by evaluating isotope patterns and fragmentation trees
- Molecular structure annotation: Predicts structural properties and searches molecular databases for matching candidates
- Compound class assignment: Automatically assigns structural classes (e.g., across NPC and ClassyFire ontologies) even for completely novel metabolites
Step 3: Fold change analysis
Once annotated, samples are grouped dynamically using a metadata tag system that supports Boolean search operations. Using simple Lucene query syntax, users can define comparison cohorts, e.g. Group A (Young Leaves), Group B (Old Leaves). PySirius then calculates fold changes at both the individual feature level and the aggregated compound class level (summing the absolute abundance of predicted chemical families to track broad pathway shifts).
Step 4: Downstream Visualisation
With all calculations structured in standard Pandas DataFrames, the results can be plotted using visualization libraries like plotly. Users can generate interactive:
- Abundance Sunburst Plots: Visually nested diagrams exploring structural distributions (like ClassyFire or NPC ontologies).
- Differential Bar & Strip Plots: Highly intuitive visualisations tracking up- and down-regulated chemical families across leaf ages.
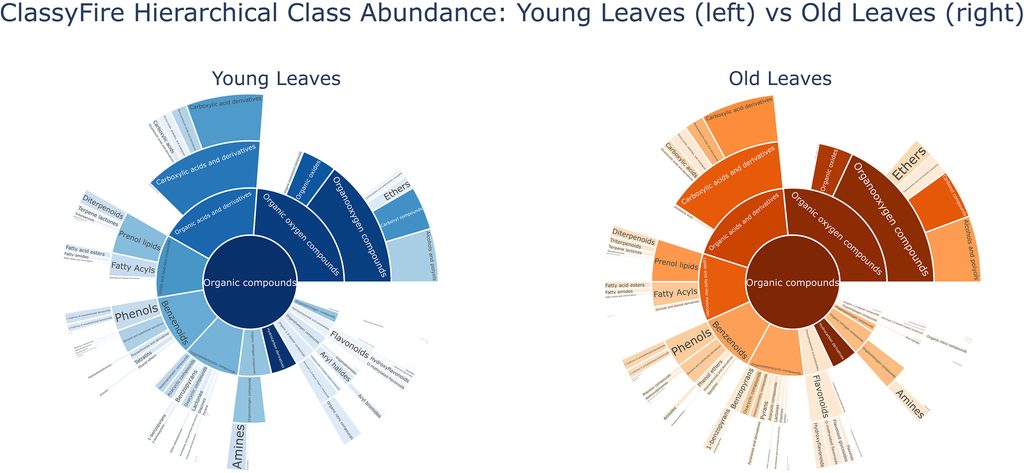
Sunburst plots for comparing the abundance of compound classes. The layering of classes follows the ClassyFire hierarchy. The color encodes abundance (dark, high abundance; light, low abundance).
(Figure from J. A. Emmert et al. STAR Protoc. (2026) doi: 10.1016/j.xpro.2026.104771, CC BY 4.0)
Access the Full Protocol
The SIRIUS REST API is a major step forward for open, auditable, and reproducible research in metabolomics. Labs can share self-contained Python notebooks that replicate an entire paper’s computational steps with a single click.
To read the complete, detailed step-by-step instructions including full source code blocks, check out the original paper on STAR Protocols or the Official PySirius Fold Change Notebook on GitHub
Jonas Alexander Emmert, Sebastian Böcker, Markus Fleischauer.
Protocol for untargeted LC-MS/MS metabolomics annotation and differential abundance analysis using the SIRIUS Python client.
STAR Protocols (2026) doi: 10.1016/j.xpro.2026.104771